Allow Multiple Values

Comparison Values Expandable to Allow Multiple Values
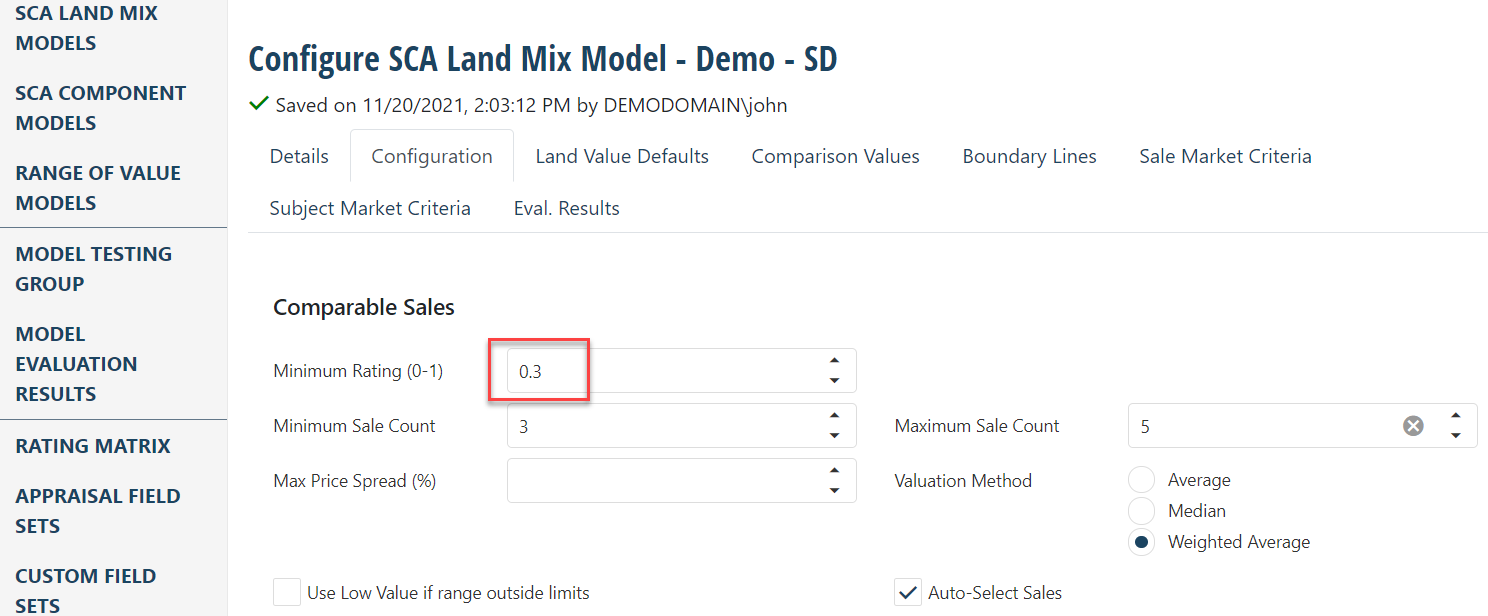
MAVEN is fed from DataLog, AgWare’s sales data storage program. MAVEN appraises and scores “each sale as a subject” in accordance with user defined model settings. Setting the model to select comparable sales with a minimal rating of 0.3, each sale must score 0.3 (red box below) or greater to be included in the pool of final sales depicted inside the circle to ultimately value the MAVEN subjects after the model is perfected.
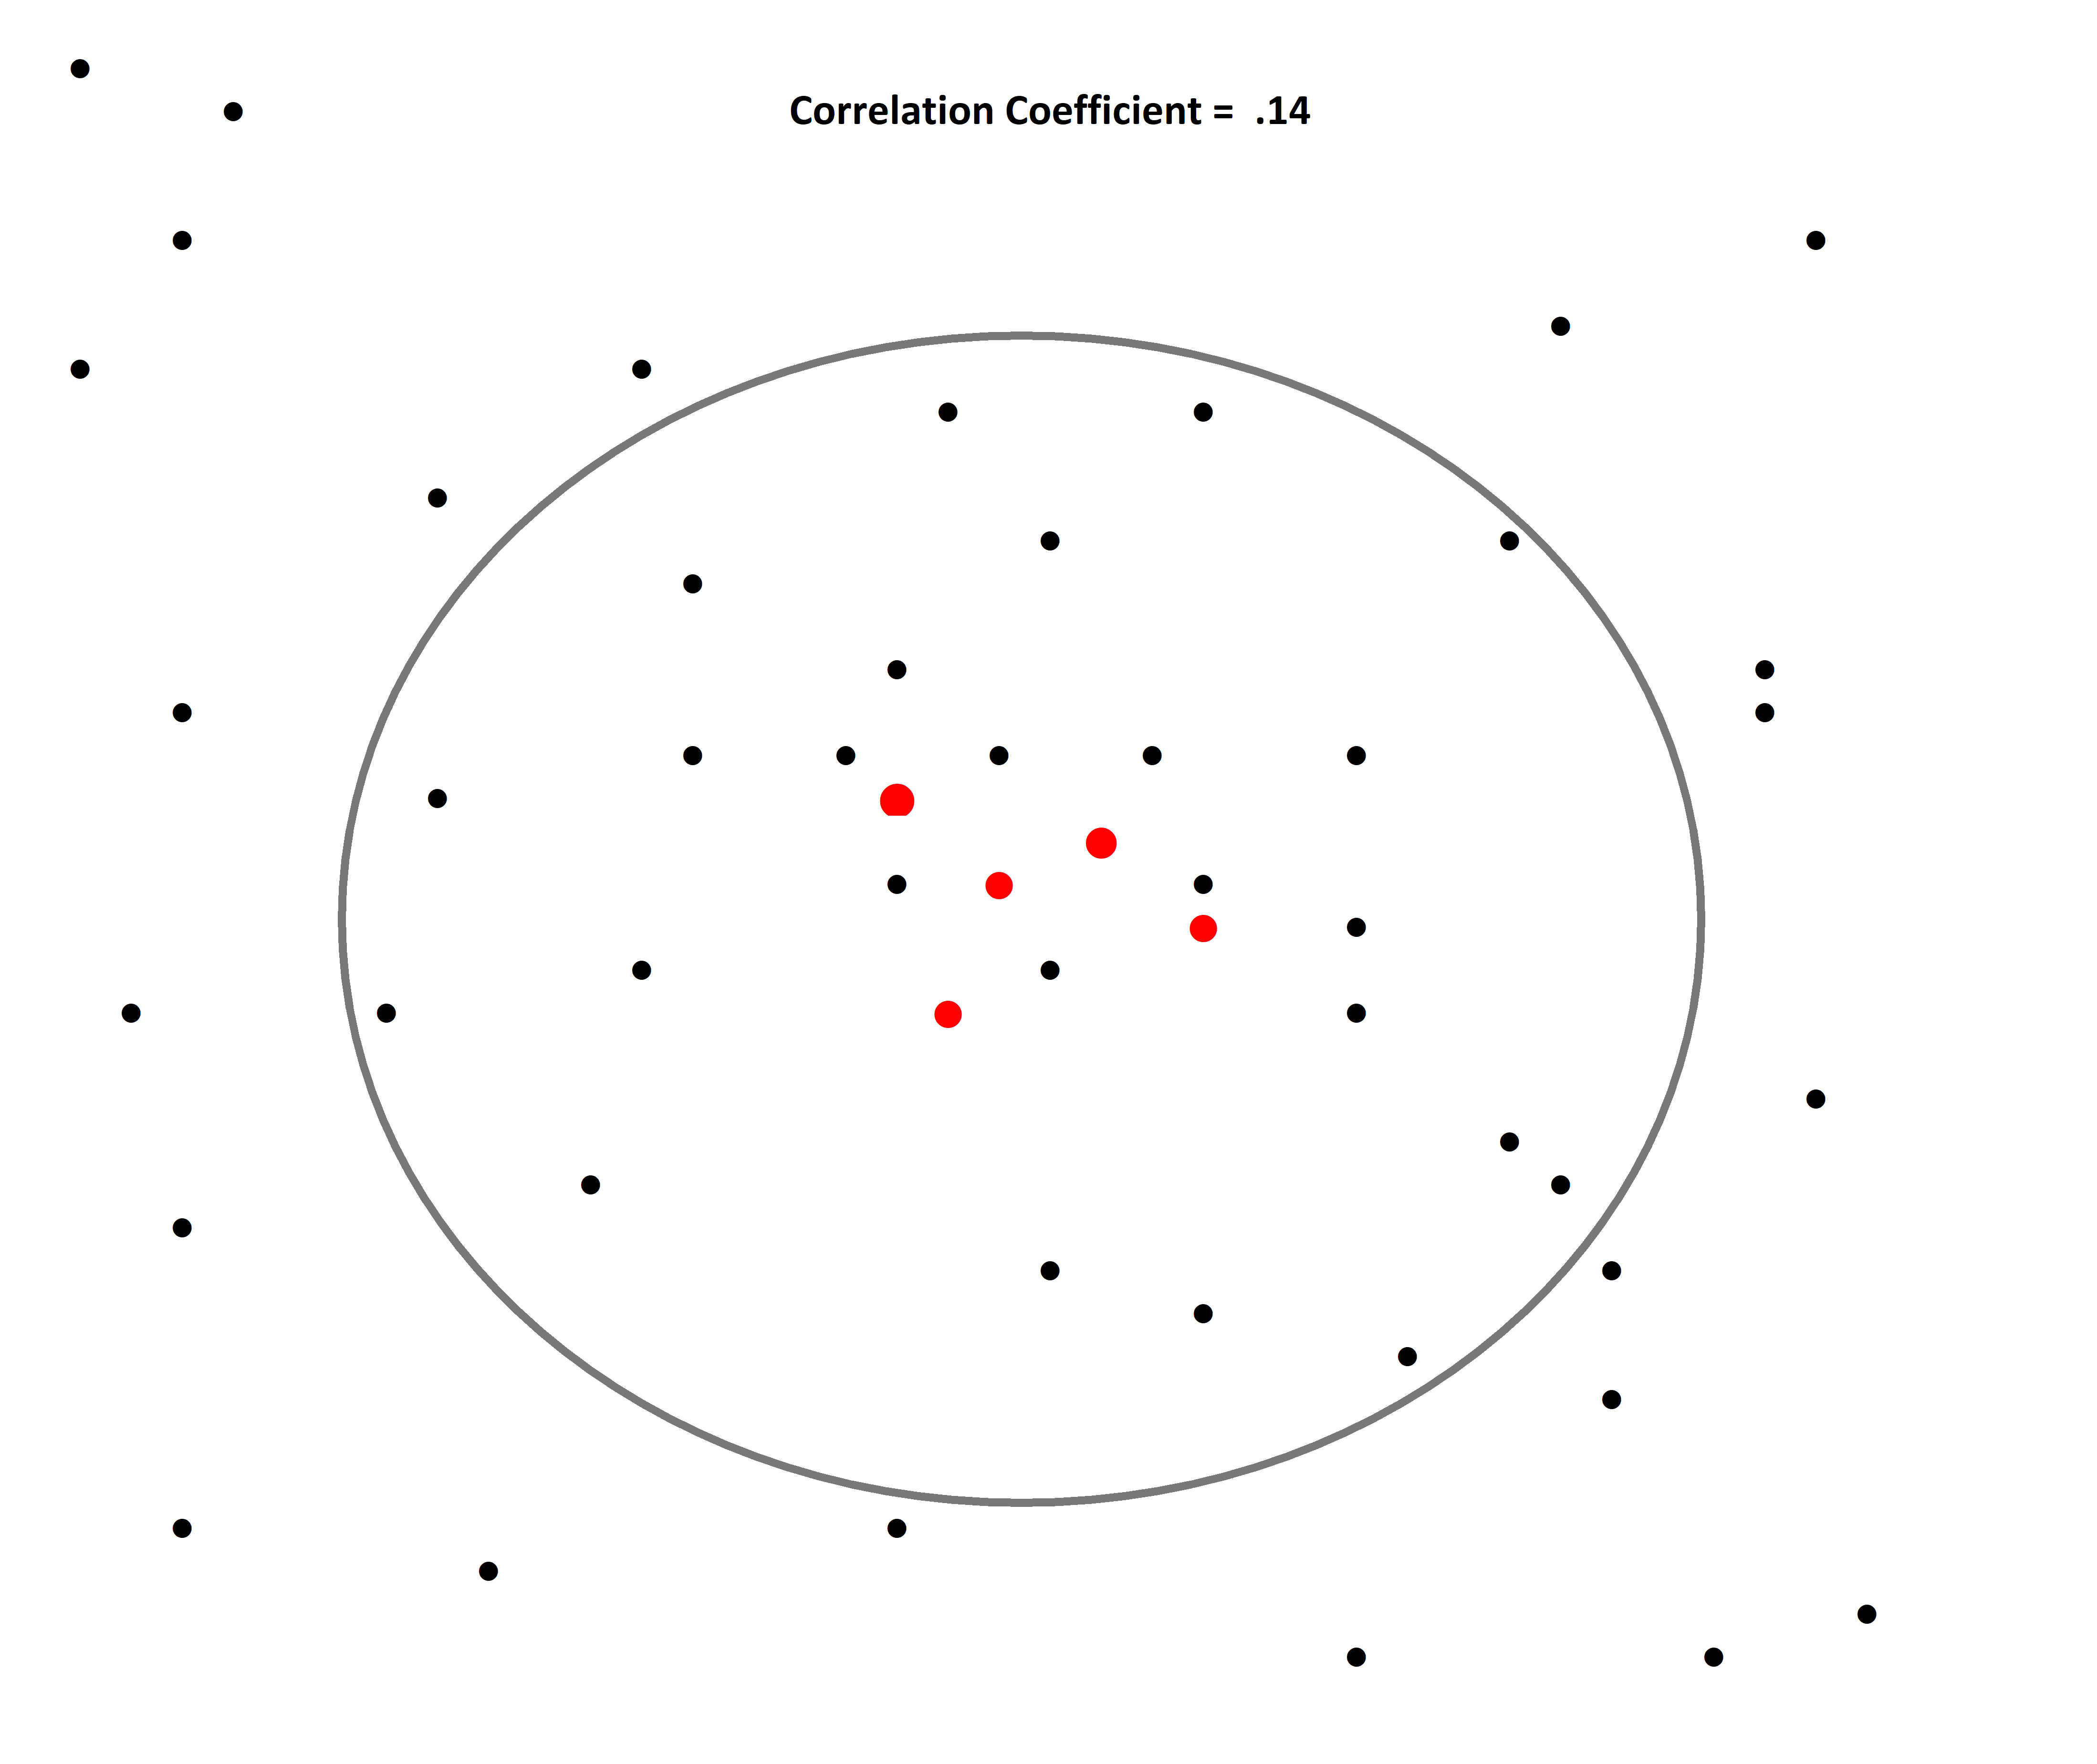
The final pool of sales would look like the graphic below. The five highest scoring sales for any subject:
To qualify more sales, adding the “Second Attribute” fields for land mix, ER, property types, and variable fields C - N have been added to DataLog.
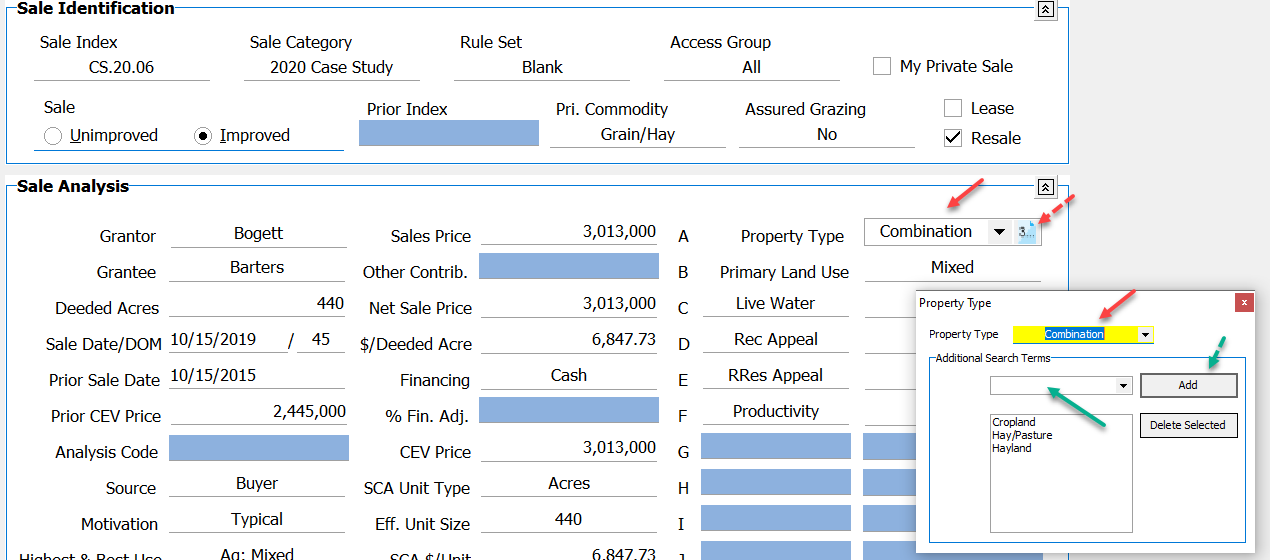
The “Second Attribute” tab is shown beside the “Property Type” (upper solid red arrow) by hovering beside the entry shown in the example as “Combination”. Then click on the attribute “Add” icon and a new data entry box opens. For the Property Type entry shown as “Combination”, secondary names of “cropland”, “hay/pasture”, and “hayland” were added which expands the qualification criteria for the sale. The user may opt for “range”, “pasture”, etc., because “Combination” includes a mixture of most land types for this market area. Thus, the qualifying sales on the prior page within the circle would be wider and include more sales rather than centering only on sales entered exactly as “Combination” under the Property Type.
Method Applied for Scoring Multiple Attributes within a single DataLog Field
The mathematic formula applies a rating for a Sale Comparison with multiple attributes as follows:
Each Subject value is rated against every Sale value. The individual ratings are summed together; then divided by the number of distinct values between the two sets. By default, these comparisons use the rating scheme of “1” if they match and “0” if they do not match, however they also support the Rating Matrices of secondary values.
The relationship between the attribute values for any element is defined by the user. For illustration, the relationship for “Topography” differences is set by the USER, either economically or from market price differences found in the competitive market. For “Land Use”, allocation ratios may be a place to start. Accordingly, if “Live Water” was an attribute identified in the market, the following relationship or price matrix may apply:
Fishery 100%, or 1.00
Live Stream 70%, or 0.70
Springs 50%, or 0.50
Example 1:
Assume a Subject and a Sale with the following “values” for their Secondary Uses:
|
Subject |
Sale |
|
Peas |
Carrots |
|
Onions |
Onions |
The rating for Secondary Land Use types would be:
|
Subject Peas vs. Sale Carrots |
0.50 |
|
Subject Peas vs. Sale Onions |
0 |
|
Subject Onions vs. Sale Carrots |
0 |
|
Subject Onions vs. Sale Onions* |
1.00 |
|
Sum |
1.50 |
*Onions is NOT part of the Rating Matrix, so the default comparison is used (1 if match, 0 if not).
The final rating is the Sum divided by the total distinct values between the two sets, or 3 elements (Peas, Carrots, and Onions).
Rating = 1.50/3 = 0.500
Example 2:
Using “Property Type” attribute for sales and subject for the example are:
|
Subject |
Sale |
|
Crop |
Hayland |
|
Pasture |
Pasture |
The attribute rating matrix is:
|
|
Crop |
Hayland |
|
Crop |
1.0 |
|
|
Hayland |
0.4 |
1.0 |
The ratings for Secondary Land Uses for “Property Type” would be:
|
Subject Crop vs. Sale Hayland |
0.40 |
|
Subject Crop vs. Sale Pasture |
0 |
|
Subject Pasture vs. Sale Hayland |
0 |
|
Subject Pasture vs. Sale Pasture* |
1.00 |
|
Sum |
1.40 |
*Pasture is NOT part of the Rating Matrix, so the default comparison is used (1 if match, 0 if not).
The final rating is the Sum divided by the total distinct values between the two sets, or 3 elements (Crop, Hayland, and Pasture).
Rating = 1.40/3 = 0.467
Example 3:
Using the “Topography” attribute for sales and subject for the example are:
|
Subject |
Sale |
|
Rolling |
Hilly |
|
Sloping |
Sloping |
The attribute rating matrix is:
|
|
Rolling |
Sloping |
|
Rolling |
1.0 |
|
|
Sloping |
0.8 |
1.0 |
The ratings for Secondary Land Use for “Topography” would be:
|
Subject Rolling vs. Sale Sloping |
0.80 |
|
Subject Hilly vs. Sale Sloping |
0 |
|
Subject Sloping vs. Sale Hilly |
0 |
|
Subject Sloping vs. Sale Sloping* |
1.00 |
|
Sum |
1.80 |
*Pasture is NOT part of the Rating Matrix, so the default comparison is used (1 if match, 0 if not).
The final rating is the Sum divided by the total distinct values between the two sets, or 3 elements (Rolling, Sloping, and Hilly).
Rating = 1.80/3 = 0.60 for “Topography”.
The scoring system is applied for every field known as “Property Type”, “Land Use”, and Variable Attributes C – N.