Setting up an SCA Model

SALES COMPARISON MODELS
The sales comparison model uses automatic sale selection and adjustments to complete a sales comparison approach for subject valuations. Sales are selected based on configurable input parameters designed to mirror the normal comp selection process during an appraisal. The exact parameters will vary depending on the region, property type, and how sales are input into the Enterprise DataLog.
When the model is run potential subjects (sales that are hypothetically considered subjects) are assigned a rating between 0 and 1 --- say 0.2 for example. The highest ranked sales are then selected and land-mix and time adjustments are performed. The resulting dollar per acre indication for the comparable sales are then combined to calculate the final opinion of value.
The Sales Comparison model allows for:
- subjects to be rejected due to lack of comparable data, or
- the range of values were too large, and
- allows for the selected sales and final opinion of value to be manually overridden by the appraiser or evaluator.
MODEL INFO
Models are given a name and description as well as a "date range" when they can be applied to subjects. The Appraiser and Evaluator Templates define what the final report content. These templates are created using the separate desktop tool for editing report templates.
Appraisal Field sets and Custom Field Sets are configured in the Setup section of Maven and provide default values for the USPAP required fields and custom fields needed in the report.
MODEL Detail [yellow box]
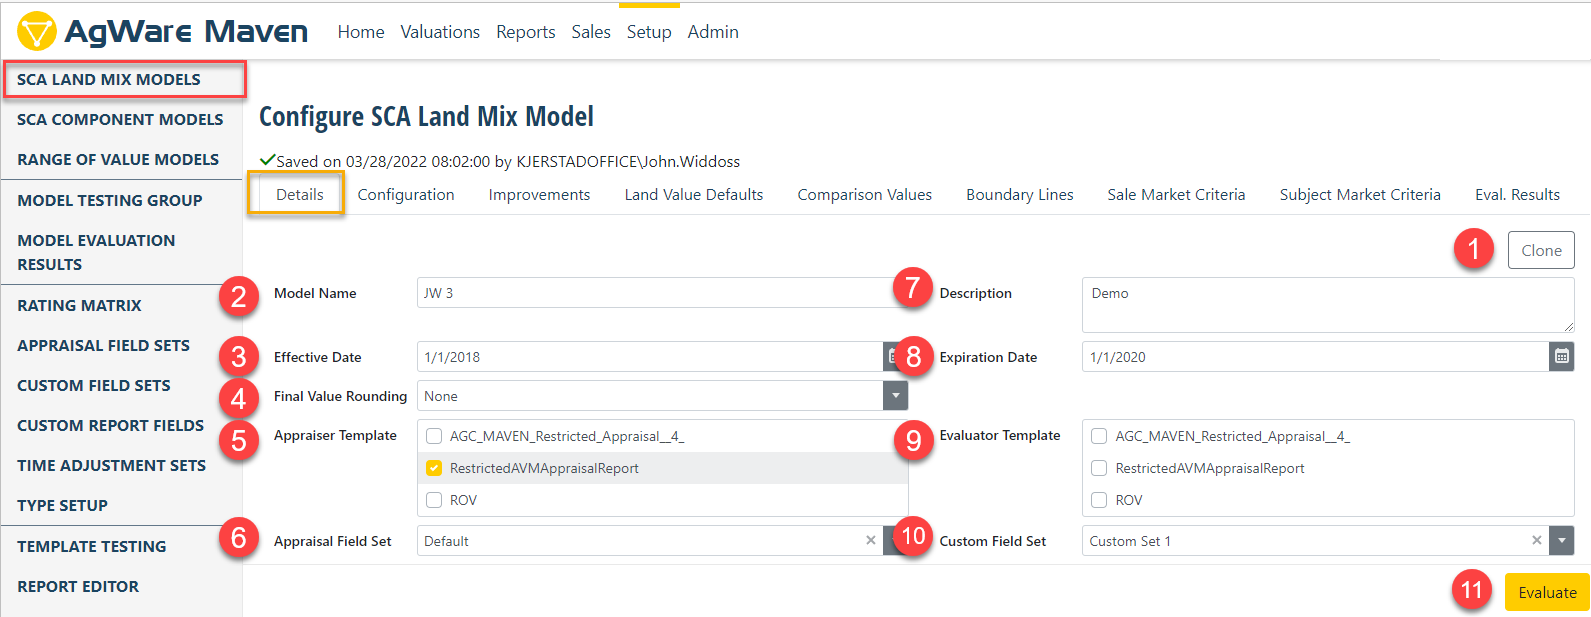
- Clone Model already established as basis to start a NEW model
- This is where users enter the model's name.
- The Effective Date the model can start being used
- Final Rounding Drop-Down
- Users can choose from the report templates are available to the appraiser (Model Administrated typically crafts the alternatives)
- The Appraisal Field Set is the report CONTENT, i.e., content that meets USPAP or some other rule-set
- The Description of the Model, e.g., SCA Model Location B (NW portion of State X)
- Date that the model ends
- Users can choose what templates are available to the Evaluator (Model Administrated typically crafts the alternatives)
- Users can set up custom field sets from the setup tab and then select them here (specific report content for organization or company)
- User can Evaluate the Model at this point to check if it is ready to begin a valuation
MODEL SETTINGS
Model Settings configure how sales are rated and what acceptable value ranges are allowed.
COMPARABLE SALES
All sales within three years of the effective date of appraisal are rated. When the rating process is finished sales must have at least the "Minimum Rating" to be selected for valuation. To continue the valuation at least the Minimum Sale Count of sales must be found. However, if more sales qualified are found they will be used up to the Preferred Sales Count.
CONFIGURATION (SCA Land Mix Model [yellow box))
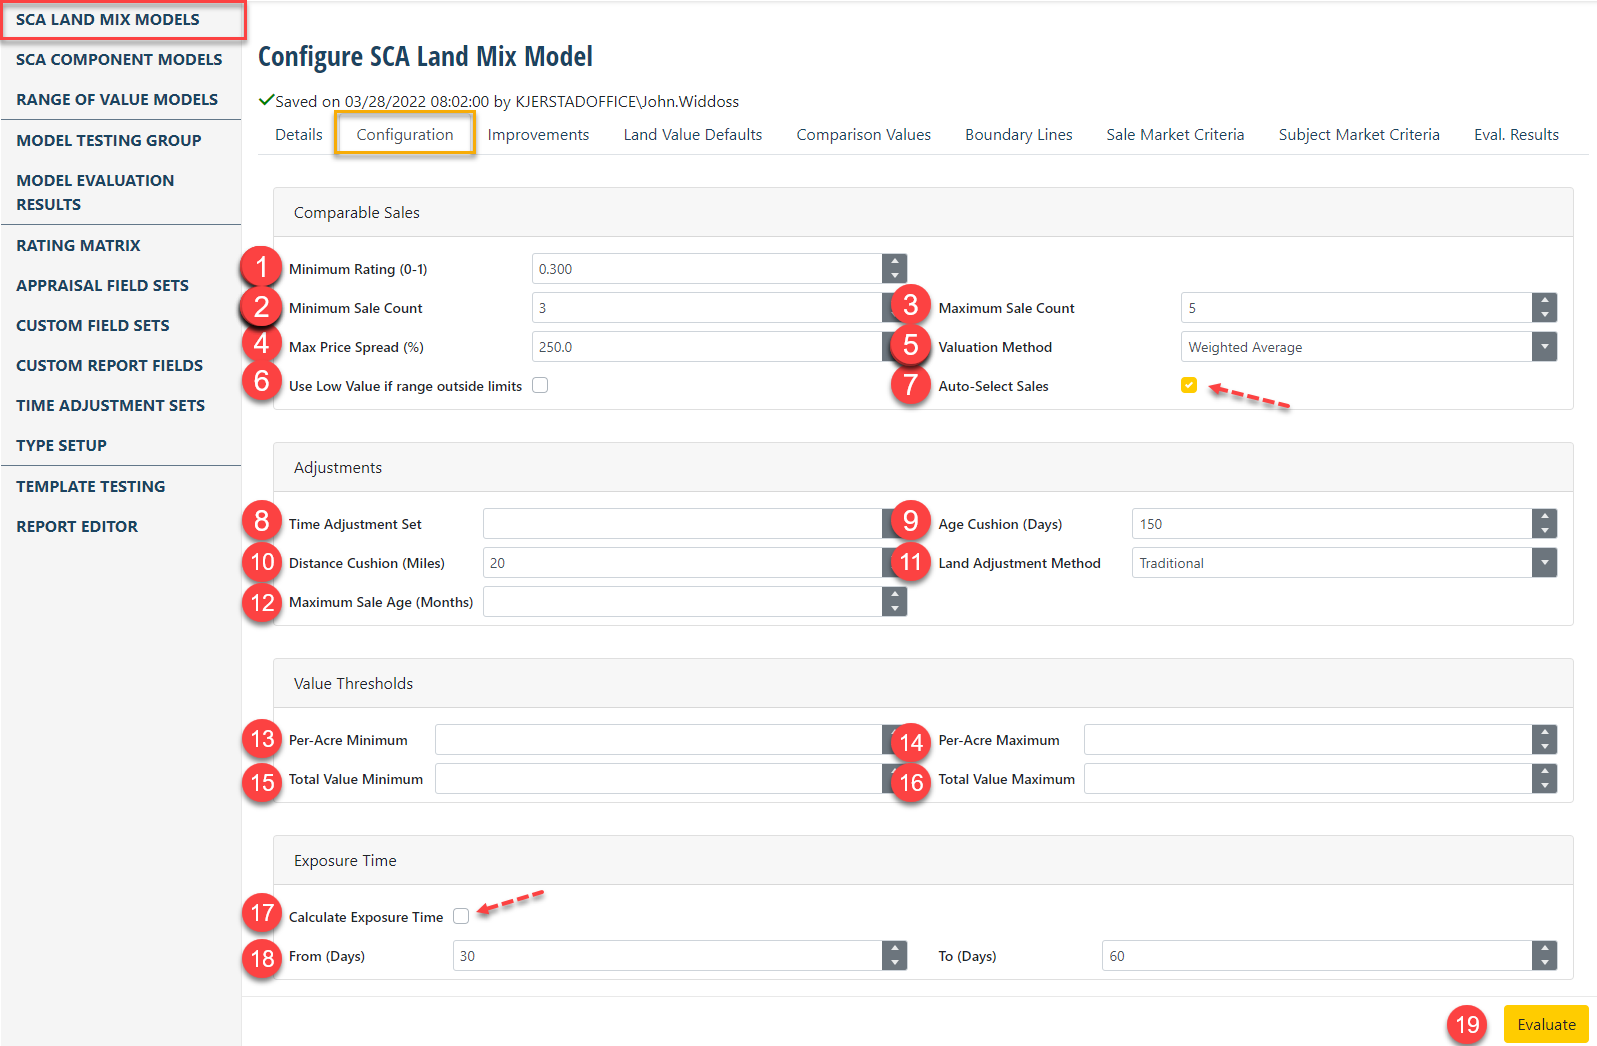
COMPARABLE SALES IDENTIFICATION SECTION ("out-of-the-box" settings and selecting the best sales)
- The minimum rating needed for a sale to be included for comparisons (0.100 is preset when opening program for the first time);
- Minimum sale count to be used in the valuation and displayed in the SCA grid (3 is preset when opening program for the first time)
- Maximum sale count to be used in the valuation and displayed in the SCA grid (5 is preset when opening program for the first time)
- After the final sales are selected and adjusted, the Dollar/Acre values must be within the "Max Price Spread (%)" to continue the valuation (300% is preset when opening program for the first time)
- The sales final $/Acre is calculated using an average, the median value, or the averaged weighted based on each sale’s final rating (weighted average is preset when opening program for the first time)
- When the dollar range of the selected sales is wide, the model can be configured to continue the valuation process using the "low values" instead of the average, mean, or weighted average
- Users can choose to let the model auto select sales (check-mark at the upper red arrow) (auto-select is preset when opening program for the first time)
ADJUSTMENT SECTION & CALCULATIONS TO COMPUTE ANSWERS --- Note, If either of the sale or subject value is a non-numeric string then the rating will be 1 if the strings match, and 0 if they do not match
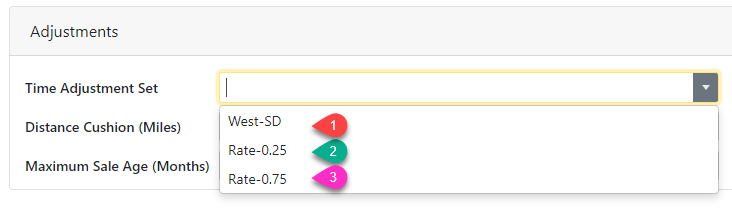
Three configuration parameters can adjust further sections of the process. The time adjustment rate is applied after the land mix adjustment is performed. The Age and Distance cushions are used when calculating the individual sale ratings for Age and Distance.
- The time adjustment (market conditions) customized and added by market area illustrated by the three choices set below, or left blank (flat market) ----
- Age cushion is set to rank older sales at a slightly lower rate that those within the initial 180-day default time-period to score each sale (comp). Simply, those at 181 to 360 days is a step below the first 180-day period and so on. Active markets should be set at shorter increments if the values (prices) are increasing.
° Age: 1 / (Age-In-Days / Cushion)
- Distance cushion involves the same "stepped" procedure. MAVEN is set at 10 miles for initial delivery of the program. Sales within 10 miles default setting of the subject are scored "1" or 100% for distance. One located from 11-20 miles away would be something less, i.e., the sale is not rejected but scored less to maintain the sale within the "comparable pool".
° Distance: 1 / (Distance / Cushion)
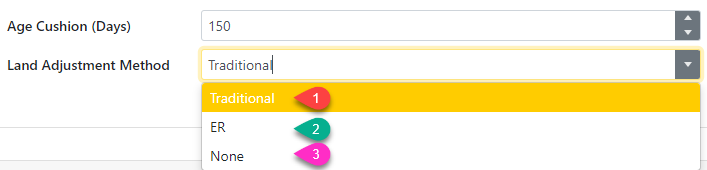
- The land adjustment methods are traditional, ER, or None. Select one from the pick-list.
° Land Mix Adjustment: First the Land Mix adjustment between the Sale and subject is calculated. Then the result is turned into a rating by calculating 1 – Abs(LandMixAdjustment / (0.25 * SaleSCADollarPerUnit))
° Land Similarity: First an overall difference is calculated by summing the acreage difference between the subject and sale on the same land type:\
That overall difference is then turned into a rating as 1 – OverallDifference/Max(SubjectAcres, SaleAcres)
- Maximum sale age can be set so MAVEN with not go back in time to find sales with a specific time-period set.
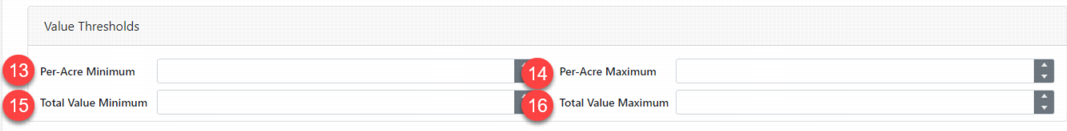
ALLOWED VALUE THRESHOLDS
The allowed value thresholds allow a valuation to be rejected for falling outside of the specified range. These values apply to the subject property, not to the selected sales. The range is entered on either a total or per acre basis. It can be used to make sure calculated values remain inside of expected normal values or stay under allowed administrative thresholds for using this particular Model. Nothing preset is this part of the model.
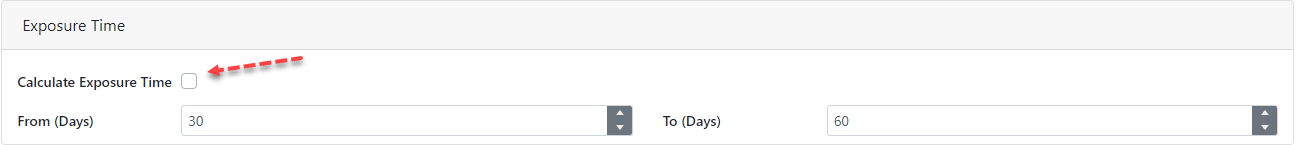
CALCULATE EXPOSURE TIME
USPAP requires that Exposure Time be calculated when the definition of market value includes it as part of the definition. Exposure time can be calculated from the Days on Market entered on the sales by checking the box (red arrow), or if DOM is not being tracked on your sales, a specified value may be manually entered where the defaults are shown when MAVEN is opened for the first time or #18 at 30 to 60 days.
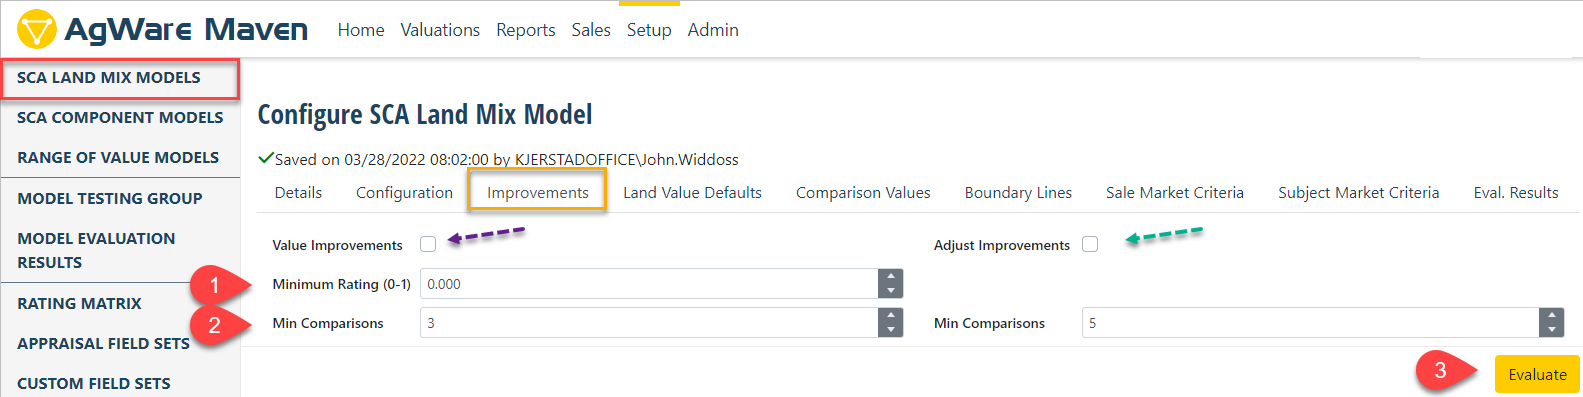
VALUE IMPROVEMENTS
By default, only the subject’s land is valued. Any entered improvements can be valued by checking this option (purple arrow).
- When the user elects to adjust for improvements (building-mix adjustment), check the box (green arrow). Individual improvements are rated selected from sales based on improvement type name, condition, utility, effective age, and RCN/Unit value.
- As with sales a minimum number of improvements must be found with the entered minimum rating.
- User can elect to "Evaluate" the model after this step, come back to this page and change settings, and re-evaluation multiple times to perfect the model.
LAND VALUE DEFAULTS
The Land Value Default option widens the pool of sales when the sale(s) lack one of the land types present within a selected subject. The unusual examples would be Roads/Waste, Site, Trees, etc. In the example, this "Default" for "Roads &/or Waste" allows Maven to assign the "low allocation per unit" found in the sale's allocation to maintain the sale in the "pool" for eventual subject valuations. Those are four (4) default options are:
- high
- average
- low
- zero.
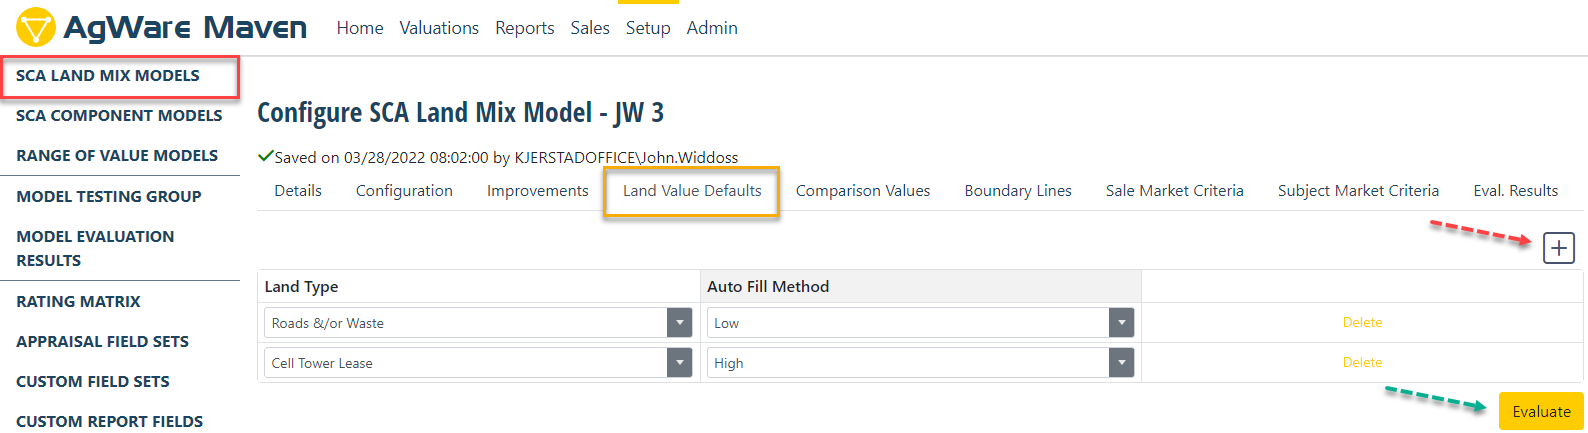
If any particular sale did not have a value shown for ... say ..... "Site", i.e., did not have actual or "ghost" value via ratios, this Maven option would allow you to set it at "high" and sill hold the sale in the pool rather than reject it because of land-mix.
When the user includes their land list for the analysis of all sales and allocates the price (manual or with ratios for all land types), this Maven process bridges the gap.
The last step when changing this screen is to "Evaluate" (green arrow above).
COMPARISON VALUES
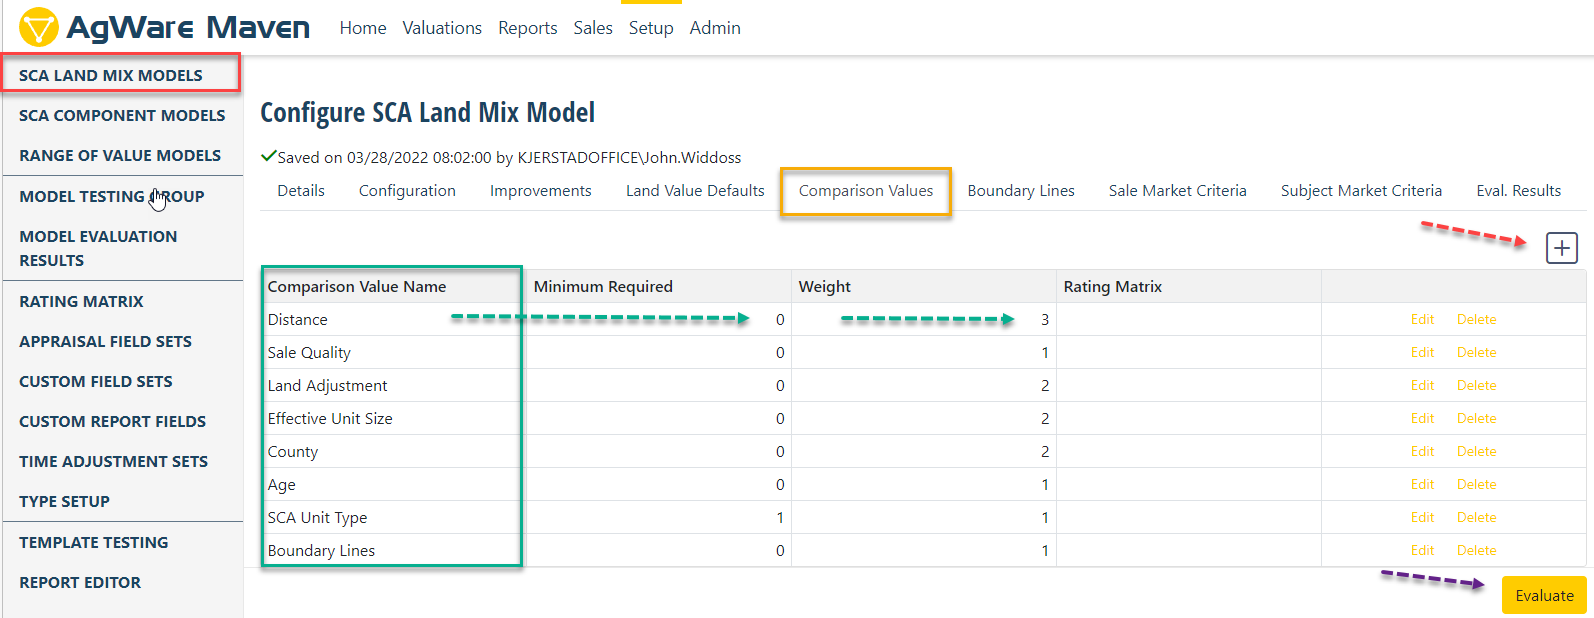
The individual comparison points are configured in this section. Each individual line item will be assigned a rating between 0 and 1. The individual values are used to calculate a weighted average as the final sale rating.
The final weighted average is calculated as: Sum(Rating * Weight) / Sum(Weights)
There are three types of comparison values that can be added.
- Strings – If either of the sale or subject value is a non-numeric string then the rating will be 1 if the strings match, and 0 if they do not match
- Numeric – If both the sale and subject’s value is a number then the rating is calculated as:
1 – (largerValue – SmallerValue)/LargerValue - Custom – the following fields are custom calculations based on multiple inputs or other settings
° Age: 1 / (Age-In-Days / Cushion)
° Distance: 1 / (Distance / Cushion)
° Land Mix Adjustment: First the Land Mix adjustment between the Sale and subject is calculated. Then the result is turned into a rating by calculating:
1 – Abs(LandMixAdjustment / (0.25 * SaleSCADollarPerUnit))
° Land Similarity: First an overall difference is calculated by summing the acreage difference between the subject and sale on the same land type:\
That overall difference is then turned into a rating:
1 – OverallDifference/Max(SubjectAcres, SaleAcres)
° Boundary Lines: If the line between the sale and subject’s geo-coded locations crosses one of the setup boundary lines the value will be 0, otherwise if it does not cross it will be 1.
° Sale Quality:
The last step above to check the model after changing the Comparison Values tab is "Evaluate" (purple arrow bottom right).
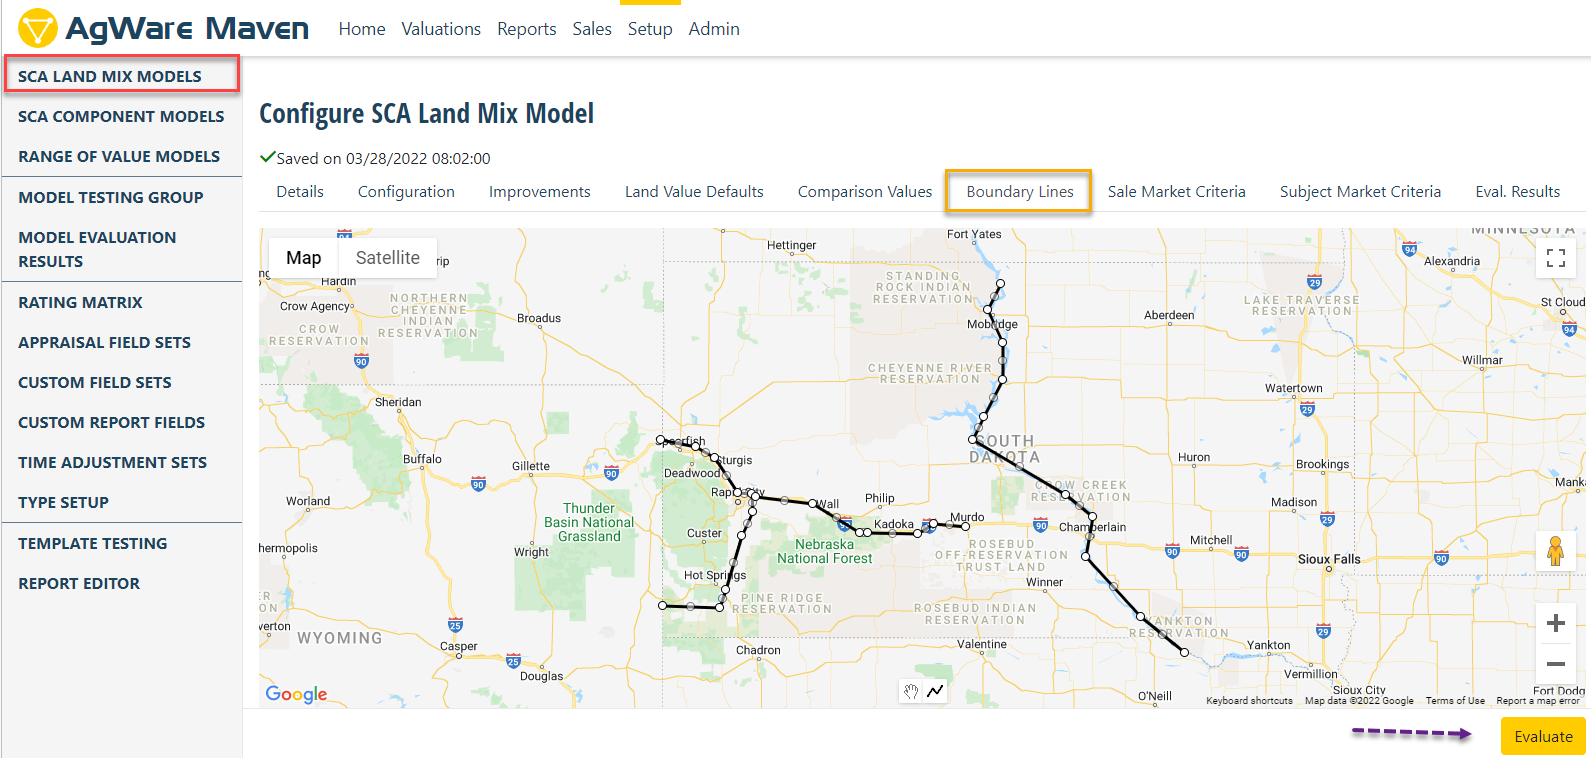
BOUNDARY LINES
The Boundary Lines section allows the drawing of lines on a map using the Google Map API. If the “Boundary Lines” comparison value item is added then the system will check to see if the line that connected sale and subject cross one of the configured boundary lines. Straight line are used, so it is not necessary to use fully closed shapes. As before, the last step when changes are made under this tab is to "Evaluate" (purple arrow shown lower right).
SALE MARKET CRITERIA
The model requires some sales settings to begin the process of judging the comparison values within the competitive area. The number of settings can be just one, or more depending on the amount of sales in that market area. It is recommended that if there are limited sales, fewer settings may be required to evaluate the subjects in that area. There are two (2) criteria in this example, i.e., state and land use.
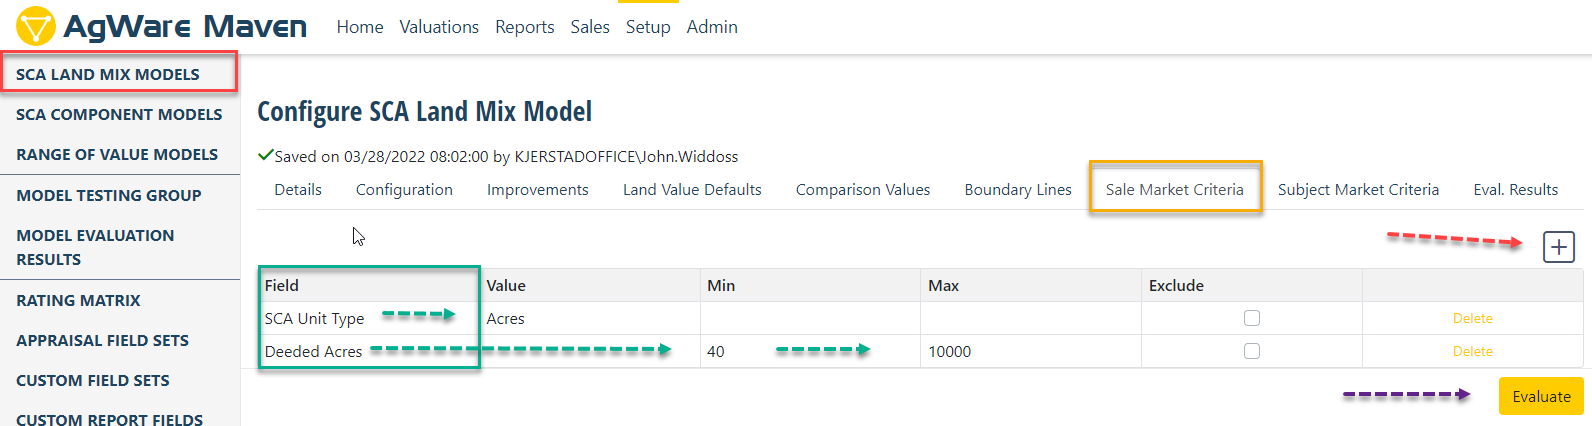
Land Use as "cropland" would require any sales picked to value subjects would have to include "cropland" as the primary land use in DataLog. It should be noted, narrowing the "window" through which sales can be selected can rule out a lot of sales in the comparison process. AgWare recommends that maybe "state" would allow Maven to work because there are other criteria in other sections of the model that can be set to select sales with similar land mixes, ER Factors, proximity and/or productivity. The examples shows "SCA Unit Type" and "Deeded Acres". The last step when changing elements on this tab is to "Evaluate" the model (purple arrow).
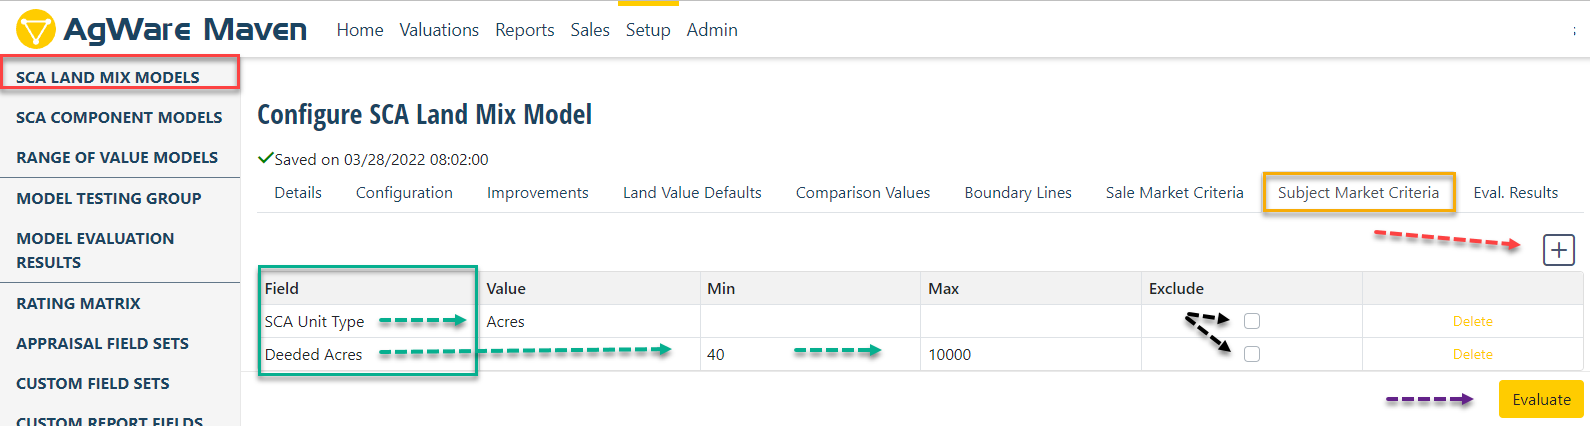
SUBJECT MARKET CRITERIA
The model also requires setting the Subject-area market criteria. As shown in the prior setting above, the number of criteria can be just one (1) or more. AgWare has the same recommendation, i.e., initially using "state" --- leaving the remaining criteria set elsewhere to control which sales are used in the comparison process. Or, enter or leave the preset categories below. The more sales that are considered on the front end of the model can be ultimately narrowed as the user identifies a particulate subject and its corresponding neighborhood criteria. The "Exclude" check-box leaves the entry for future "Cloned" models and changing whether some elements are excluded for different models and locations. The last step when changing elements on this tab is to "Evaluate" the model (purple arrow).
The FINAL Evaluation produces something similar as shown below. ADDITIONAL comments and explanations follow the graphic.
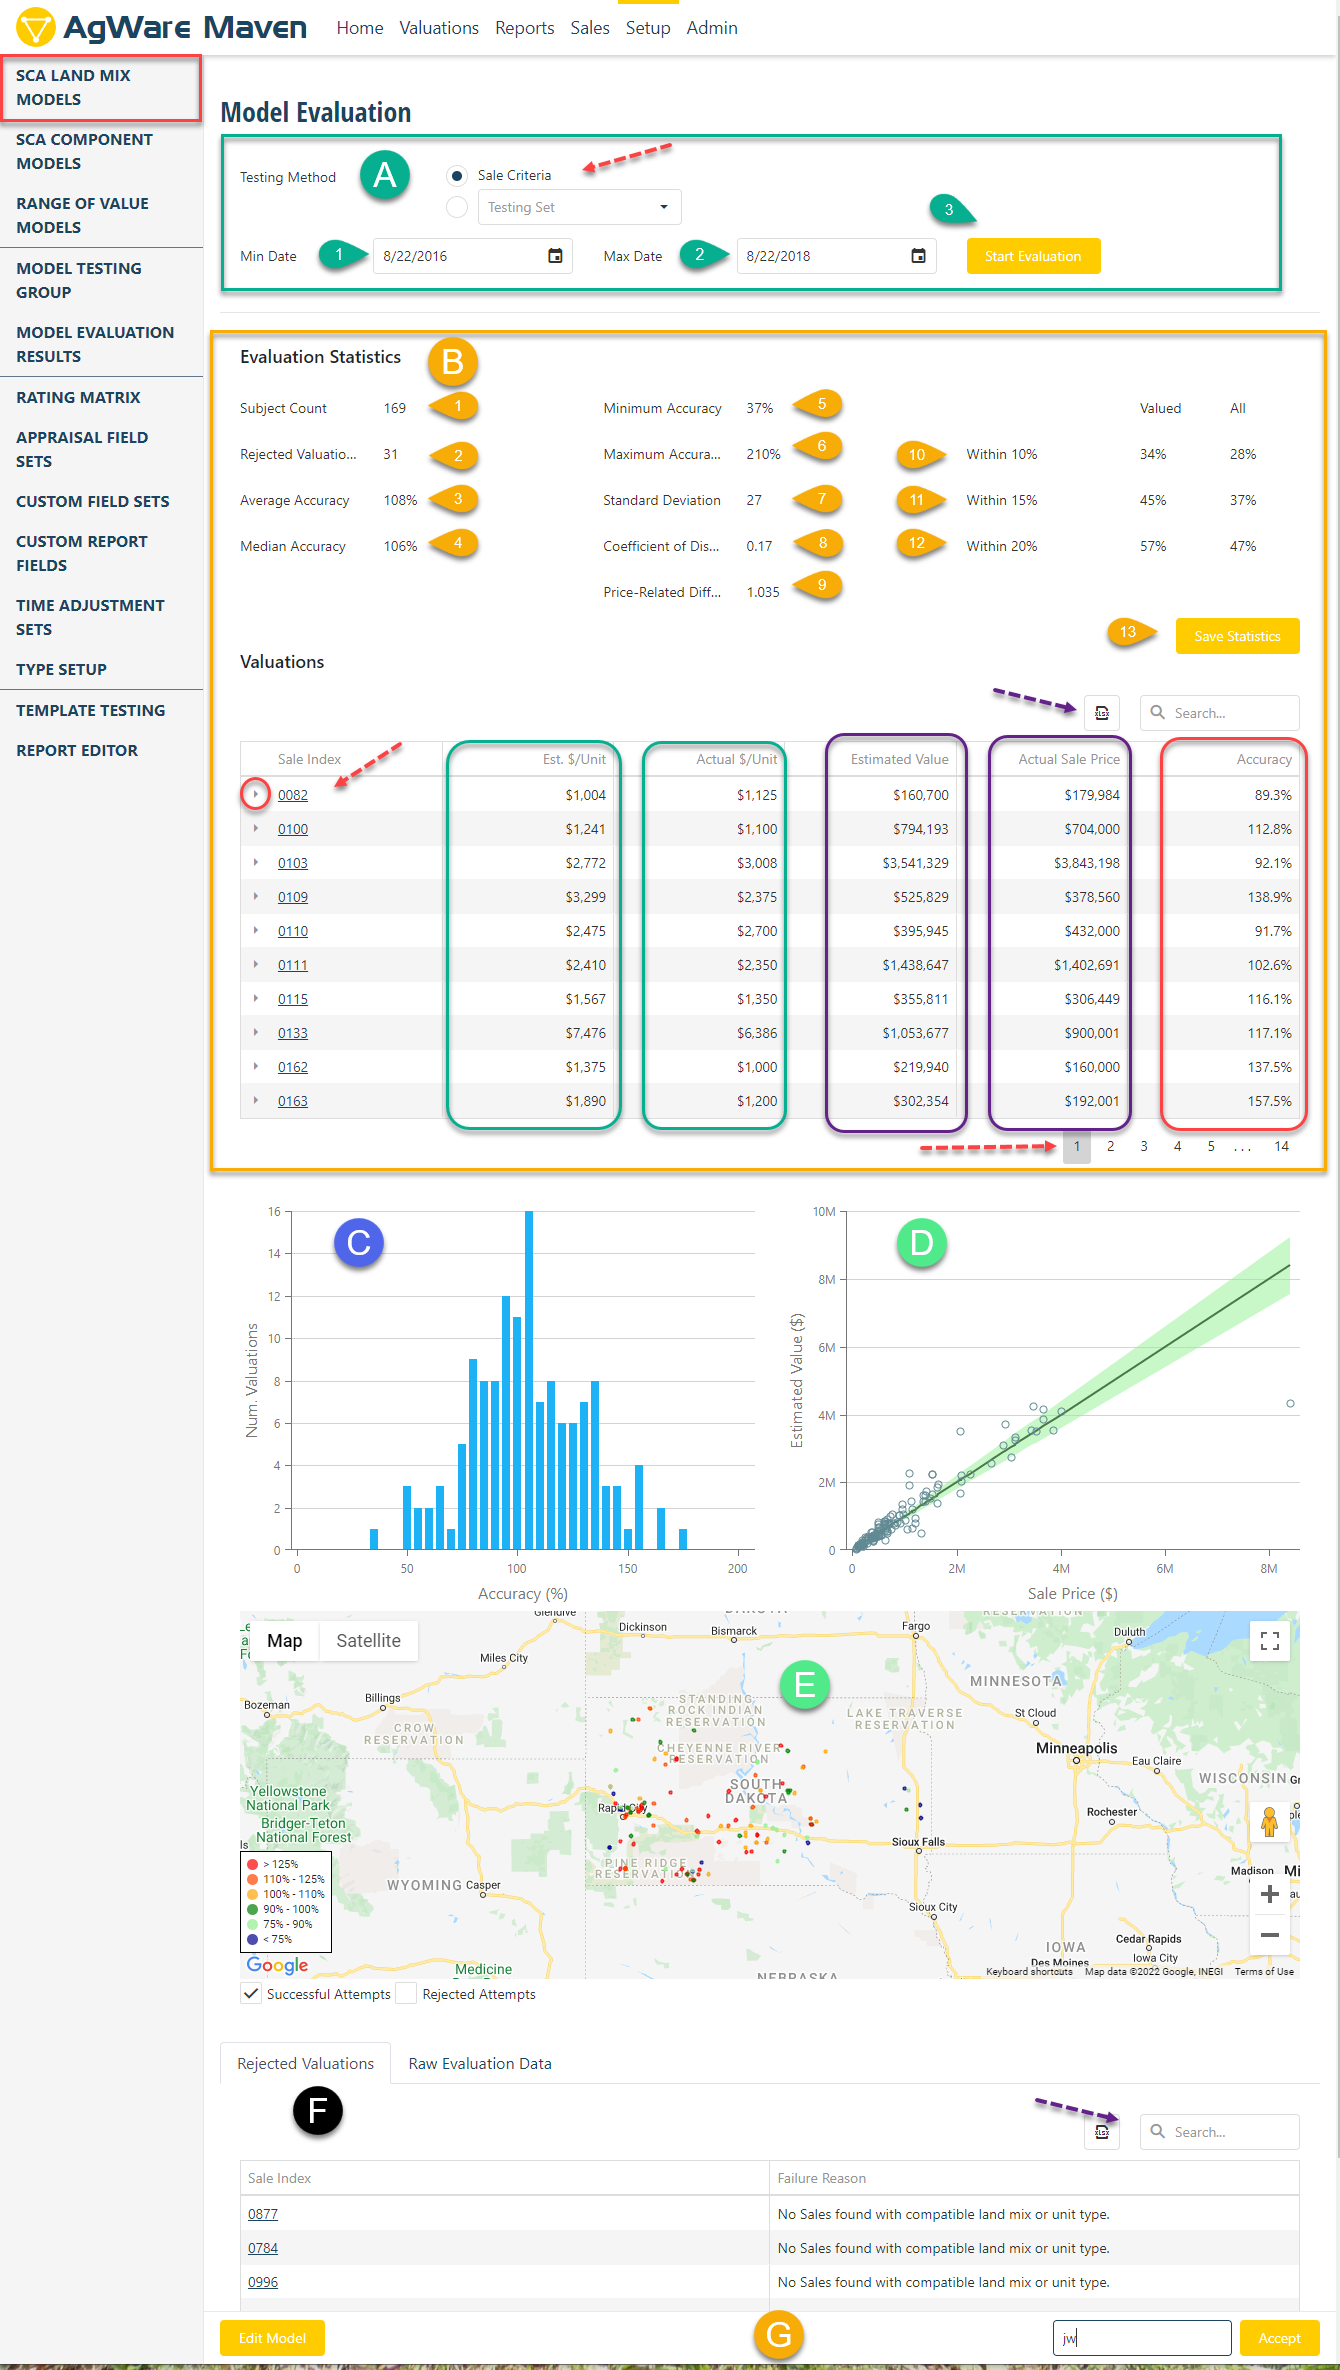
MODEL EVALUATION
A. Green (border) contains the "Testing Method". "Sale Criteria" shown (toggle), or the user can enter a custom setting.
- Model Begin Date
- Model End Date
- Start Evaluation Button
B. Evaluation Statistics (Yellow border)
- Subject Count (Sales in this DataBase)
- Rejected Valuations (those outside the circle in "concepts and methodology" (left "?" above this section)
- Average Accuracy percentage
- Median Accuracy percentage
- Minimum Accuracy percentage
- Maximum Accuracy percentage
- Standard Deviation
- Coefficient of Dispersion
- Price-Related Differential
- Valuations within 10% of Selling Price (Sales as "Subjects"): Valued and All
- Valuations within 15% of Selling Price (Sales as "Subjects"): Valued and All
- Valuations within 20% of Selling Price (Sales as "Subjects"): Valued and All
- Save Statistics
Valuations NOTE: purple dashed arrow is "Search" tool, if user knows record number
Column #1 (no color): Sale Index
red circle = triangle that when hit, expands and shows the content of that sale (red arrow)
Column #2 (green): Estimated $/Unit from Model, e.g., $/Acre, $/AUM, etc.
Column #3 (green): Actual $/Unit to show user contrast between estimated and actual
Column #4 (purple): Estimated Total Value ($/Unit x Total Units)
Column #5 (purple): Actual Sale Price to show user contrast between estimated and actual
Column #6 (red): Accuracy of estimated shown as a percentage of actual
NOTE: Click on the column headers with that section and the data is "re-ordered" in the opposing direction, i.e., lowest to highest, then click to show highest to lowest.
Red Arrow at the bottom of this section shows pages or successive screens since only ten (10) sales can be display at a time
C. Bar Chart showing the sale distribution. Ideal would occur when the bar-graph shows a "bell-curve"
D. Scatter-Gram of the sales. Green "cone" is +/- 10% from median.
E. Map showing sale locations
green dots = location of sales within in 10% cone
red dots = location of sales below the 10% cone
blue dots = location of sales above the 10% cone
F. Rejected sale, or the 31 sales for this example shown as B-2. NOTE: purple dashed arrow is "Search" tool, if user knows record number
Reason why the sales failed to meet the 0.300 minimum rating set in the Models "Configuration" tab
G Yellow "Edit" Model without switching tabs and "re-evaluate", or "sign" or "initial" Model acceptance in the lower right portion of the image.